
volatility2与3使用笔记
volatility2与3使用笔记
需分析内容
- 系统进程信息
- pstree
- psaux
- 系统网络信息
- 系统打开文件
提供标识LiME制作内存镜像文件, 可以利用banner中关键词搜索“Linux Version”找到相关的内核版本. 从而再进一步选择Volatility2的Profile或者Volatility3的Symbols.
volatility3
前言
Linux
模块列表
| 模块名称 | 简要功能介绍 |
|---|---|
| plugins.linux.bash | 提取和分析Bash历史记录 |
| plugins.linux.check_afinfo | 检查网络地址族信息 |
| plugins.linux.check_creds | 检查和提取进程凭证信息 |
| plugins.linux.check_idt | 检查和分析中断描述表 (IDT) |
| plugins.linux.check_modules | 检查已加载的内核模块 |
| plugins.linux.check_syscall | 检查和分析系统调用表 (Syscall Table) |
| plugins.linux.elfs | 检查和分析 ELF 格式的二进制文件 |
| plugins.linux.envars | 提取和分析环境变量 |
| plugins.linux.envvars | 提取和分析环境变量 |
| plugins.linux.iomem | 提取和分析物理内存映射 |
| plugins.linux.keyboard_notifiers | 检查和分析键盘事件通知 |
| plugins.linux.kmsg | 提取和分析内核消息缓冲区 (KMSG) |
| plugins.linux.lsmod | 列出已加载的内核模块 |
| plugins.linux.lsof | 列出打开的文件和进程 |
| plugins.linux.malfind | 检测并分析可能的恶意进程 |
| plugins.linux.mountinfo | 提取和分析挂载信息 |
| plugins.linux.proc | 提取和分析进程信息 |
| plugins.linux.psaux | 列出详细的进程信息 |
| plugins.linux.pslist | 列出进程列表 |
| plugins.linux.psscan | 扫描物理内存以查找进程结构 |
| plugins.linux.pstree | 列出进程层次结构 |
| plugins.linux.sockstat | 提取和分析网络套接字信息 |
| plugins.linux.tty_check | 检查和分析tty设备 |
MacOS
模块列表
| 模块名称 | 简要功能介绍 |
|---|---|
| plugins.mac.bash | 提取和分析Bash历史记录 |
| plugins.mac.check_syscall | 检查和分析系统调用表 (Syscall Table) |
| plugins.mac.check_sysctl | 检查和分析系统控制变量 |
| plugins.mac.check_trap_table | 检查和分析陷阱表 (Trap Table) |
| plugins.mac.ifconfig | 获取和分析网络接口配置信息 |
| plugins.mac.kauth_listeners | 列出内核认证侦听器 |
| plugins.mac.kauth_scopes | 列出内核认证范围 |
| plugins.mac.kevents | 检查和分析内核事件 (Kevents) |
| plugins.mac.list_files | 列出文件和目录 |
| plugins.mac.lsmod | 列出已加载的内核模块 |
| plugins.mac.lsof | 列出打开的文件和进程 |
| plugins.mac.malfind | 检测并分析可能的恶意进程 |
| plugins.mac.mount | 检查和分析挂载信息 |
| plugins.mac.netstat | 提取和分析网络连接信息 |
| plugins.mac.proc_maps | 提取和分析进程内存映射 |
| plugins.mac.psaux | 列出详细的进程信息 |
| plugins.mac.pslist | 列出进程列表 |
| plugins.mac.pstree | 列出进程层次结构 |
| plugins.mac.socket_filters | 检查和分析套接字过滤器 |
| plugins.mac.timers | 检查和分析内核计时器 (Timers) |
| plugins.mac.trustedbsd | 检查和分析TrustedBSD模块 |
| plugins.mac.vfsevents | 检查和分析VFS事件 |
Windows
模块列表
| 模块名称 | 简要功能介绍 | 用法 |
|---|---|---|
| plugins.windows.registry | 用于操作和分析Windows注册表的模块 | |
| plugins.windows.bigpools | 分析和提取Windows大内存池中的对象 | |
| plugins.windows.cachedump | 导出和分析Windows缓存的模块 | |
| plugins.windows.callbacks | 分析和提取Windows回调函数的模块 | |
| plugins.windows.cmdline | 提取和分析Windows进程的命令行参数 | |
| plugins.windows.crashinfo | 提取和分析Windows崩溃转储信息 | |
| plugins.windows.devicetree | 分析和提取Windows设备树的模块 | |
| plugins.windows.dlllist | 列出Windows进程加载的DLL模块 | vol.py -f “/path/to/file” windows.dlllist ‑‑pid |
| plugins.windows.driverirp | 分析和提取Windows驱动程序的IRP调用 | |
| plugins.windows.drivermodule | 分析和提取Windows驱动程序模块的模块 | |
| plugins.windows.driverscan | 扫描物理内存以查找Windows驱动程序结构 | |
| plugins.windows.dumpfiles | 导出和分析Windows进程的内存转储 | vol.py -f “/path/to/file” -o “/path/to/dir” windows.dumpfiles ‑‑pid |
| plugins.windows.envars | 提取和分析Windows进程的环境变量 | |
| plugins.windows.filescan | 在物理内存中扫描文件结构 | |
| plugins.windows.getservicesids | 获取Windows服务的安全标识符 | |
| plugins.windows.getsids | 获取Windows进程和线程的安全标识符 | |
| plugins.windows.handles | 列出Windows进程的句柄和对象(PID、进程、偏移量、句柄值、类型、grantedaccess、名称) | vol.py -f “/path/to/file” windows.handles ‑‑pid |
| plugins.windows.hashdump | 导出和分析Windows密码哈希值 | |
| plugins.windows.info | 提取和分析Windows系统信息 | vol.py -f “/path/to/file” windows.info |
| plugins.windows.joblinks | 检查和分析Windows作业链接 | |
| plugins.windows.ldrmodules | 列出Windows进程加载的模块 | |
| plugins.windows.lsadump | 导出和分析Windows本地安全认证信息 | |
| plugins.windows.malfind | 检测并分析可能的恶意进程 | |
| plugins.windows.mbrscan | 扫描物理内存中的主引导记录 | |
| plugins.windows.memmap | 列出物理内存映射 | vol.py -f “/path/to/file” -o “/path/to/dir” windows.memmap ‑‑dump ‑‑pid |
| plugins.windows.mftscan | 扫描物理内存中的Master File Table (MFT) | |
| plugins.windows.modscan | 扫描物理内存中的模块结构 | |
| plugins.windows.modules | 列出Windows进程加载的模块 | |
| plugins.windows.mutantscan | 扫描物理内存以查找Windows互斥体结构 | |
| plugins.windows.netscan | 扫描物理内存以查找Windows网络连接结构 | |
| plugins.windows.netstat | 提取和分析Windows网络连接信息 | |
| plugins.windows.poolscanner | 扫描物理内存以查找Windows内存池结构 | |
| plugins.windows.privileges | 列出Windows进程的特权 | |
| plugins.windows.pslist | 列出Windows进程列表 | |
| plugins.windows.psscan | 扫描物理内存以查找Windows进程结构 | |
| plugins.windows.pstree | 列出Windows进程层次结构 | |
| plugins.windows.sessions | 列出Windows登录会话 | |
| plugins.windows.skeleton_key_check | 检查是否存在Skeleton Key攻击 | |
| plugins.windows.ssdt | 分析和提取Windows系统服务描述符表 (SSDT) | |
| plugins.windows.strings | 提取和分析Windows进程中的字符串 | |
| plugins.windows.svcscan | 扫描物理内存以查找Windows服务结构 | |
| plugins.windows.symlinkscan | 扫描物理内存以查找Windows符号链接结构 | |
| plugins.windows.vadinfo | 提取和分析Windows虚拟地址描述符 (VAD) | |
| plugins.windows.vadwalk | 遍历Windows虚拟地址描述符 (VAD) | |
| plugins.windows.verinfo | 提取和分析Windows可执行文件版本信息 | |
| plugins.windows.volshell | 在Windows上运行Volatility命令 | |
| plugins.windows.wintree | 列出Windows窗口层次结构 | |
| plugins.windows.yarascan | 使用YARA规则扫描Windows内存 |
注册表
1 | vol.py -f "/path/to/file" windows.registry.hivescan |
转储文件
1 | vol.py -f "/path/to/file" -o "/path/to/dir" windows.dumpfiles |
volatility2
Windows
基础信息
检测这个内存镜像是哪个操作系统的内存镜像以及各种内存信息
1 | volatility_2.6_win64_standalone.exe -f FILENAME imageinfo |

首先的一个重要参数是Suggested Profile 也就是他的电脑版本号,只有这个版本号才能进行之后的步骤。
例图中的Suggested Profile是有四个信息,但是大概率指向的版本是第一个。
如果Suggested Profile后面带了一个Instantiated with XXXXX就是说他建议是哪个电脑版本号,所以用它建议的就行,当然这个情况也不是全都有的,有时候他不建议,你就选你自己的就行。
下方的Image date and time是这个内存镜像的制作时间,默认是UTC+0的时间,这个参数的下一个Image Local date and time就是我们的UTC+8的时间(即本机的时区)。
进程分析
pslist命令不仅显示了所有正在运行的进程,而且给出了有价值的信息,比如PID、PPID、启动的时间。
pstree与pslist命令不同的地方在于还可以识别子进程以及父进程
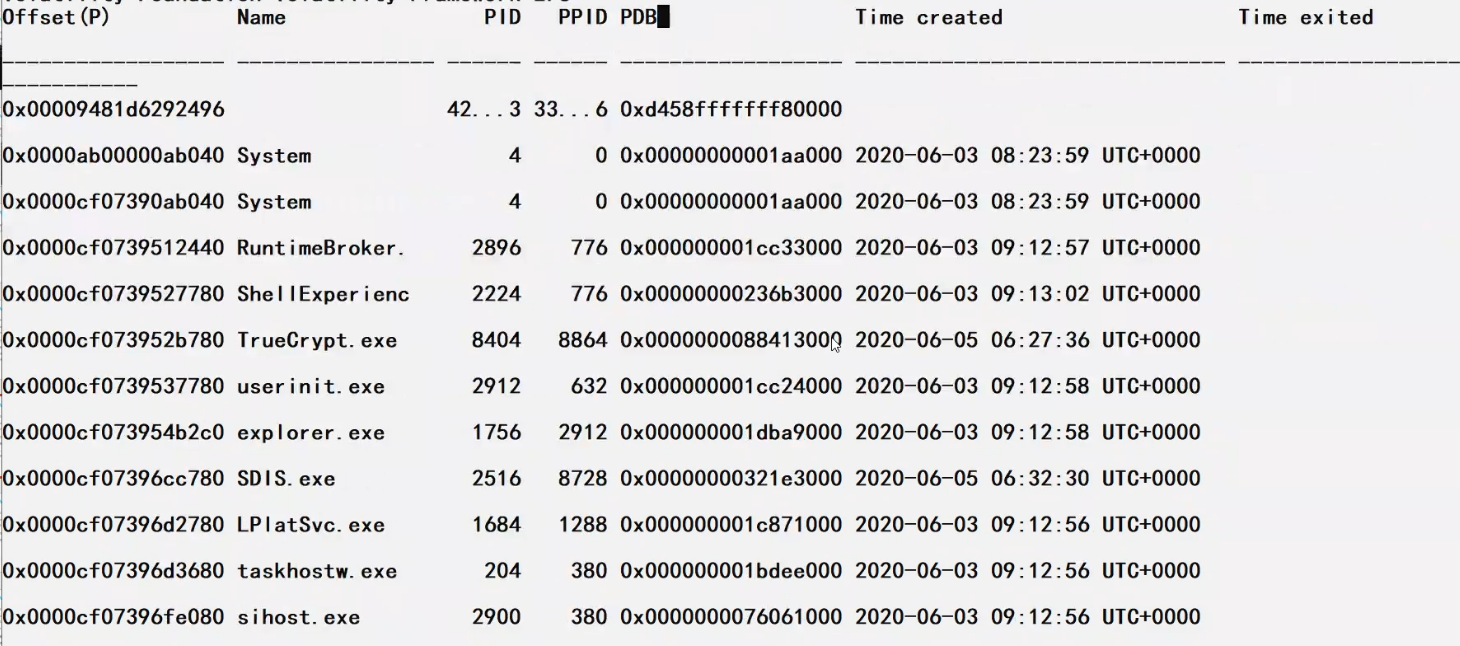
psscan命令可以显示出被恶意软件比如rootkit为了躲避用户或杀毒软件而隐藏的进程
psxview查看进程列表(psx视图)
1 | volatility_2.6_win64_standalone.exe -f FILENAME --profile=版本号 pslist |
该命令为列出内存中的进程,包括进程PID、PPID以及启动时间,并可以清楚的看到父子进程的关系。

如果遇到隐藏的进程,可以使用如下命令
1 | volatility_2.6_win64_standalone.exe -f FILENAME --profile=版本号 psscan |
该命令为列出内存中的所有进程,包括进程PID、PPID以及启动时间,并可以清楚的看到父子进程的关系。
如果遇到名称伪装的进程,使用如下命令
进程树
1 | volatility_2.6_win64_standalone.exe -f FILENAME --profile=版本号 pstree |
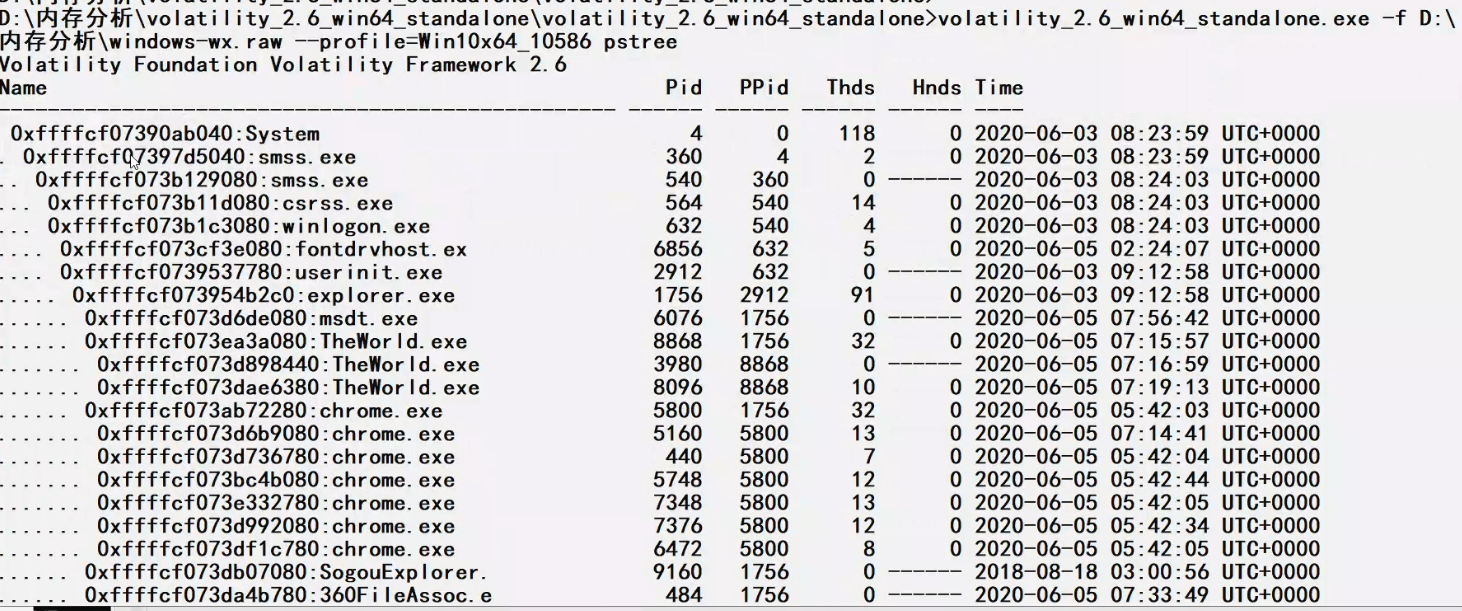
有些恶意进程会伪装成同名进程,通过进程树,看他不归属于不正常进程
例:很多恶意进程会伪装成svchost.exe,但svchost.exe的真正父进程是services.exe的。
动态链接库
就是所谓的dll文件
1 | volatility_2.6_win64_standalone.exe -f FILENAME --profile=版本号 dlllist |
该命令能看到每个进程(程序)运行所需要的所有动态链接库

网络连接
1 | volatility_2.6_win64_standalone.exe -f FILENAME --profile=版本号 netscan |
该命令可查看所有进程的连接协议、本地地址、连接地址、状态、监听端口以及pid。

内核驱动
1 | volatility_2.6_win64_standalone.exe -f FILENAME --profile=版本号 modules |
该命令查看内核驱动,modscan、driverscan可查看一些隐藏的内核驱动。
提取进程程序
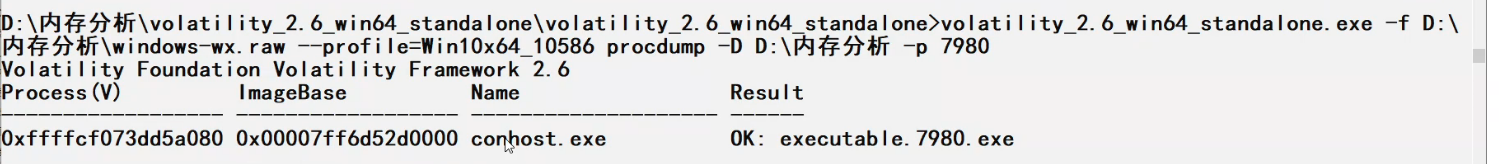
1 | volatility_2.6_win64_standalone.exe -f FILENAME --profile=版本号 procdump -D 路径 -p 进程号PID |
注意此命令会自动修改名称,修改后的名称就是图中的 Result的内容
内存文件
1 | volatility_2.6_win64_standalone.exe -f FILENAME --profile=版本号 filescan |
该命令能扫描内存中的文件

导出内存中缓存的文件
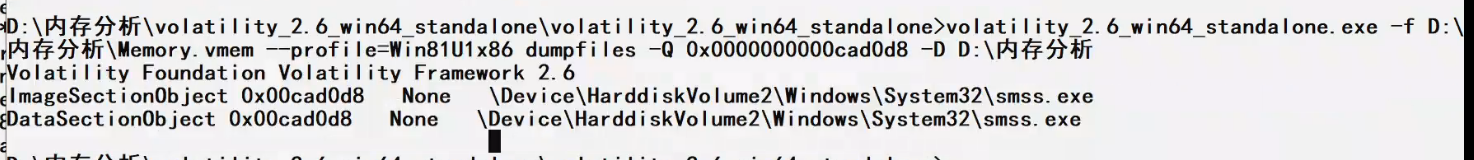
1 | volatility_2.6_win64_standalone.exe -f FILENAME --profile=版本号 dumpfiles -Q 内存中的位置 -D 导出路径 |
该命令能导出内存中缓存的文件
-Q的内容就是filescan中第一行的Offset
注册表
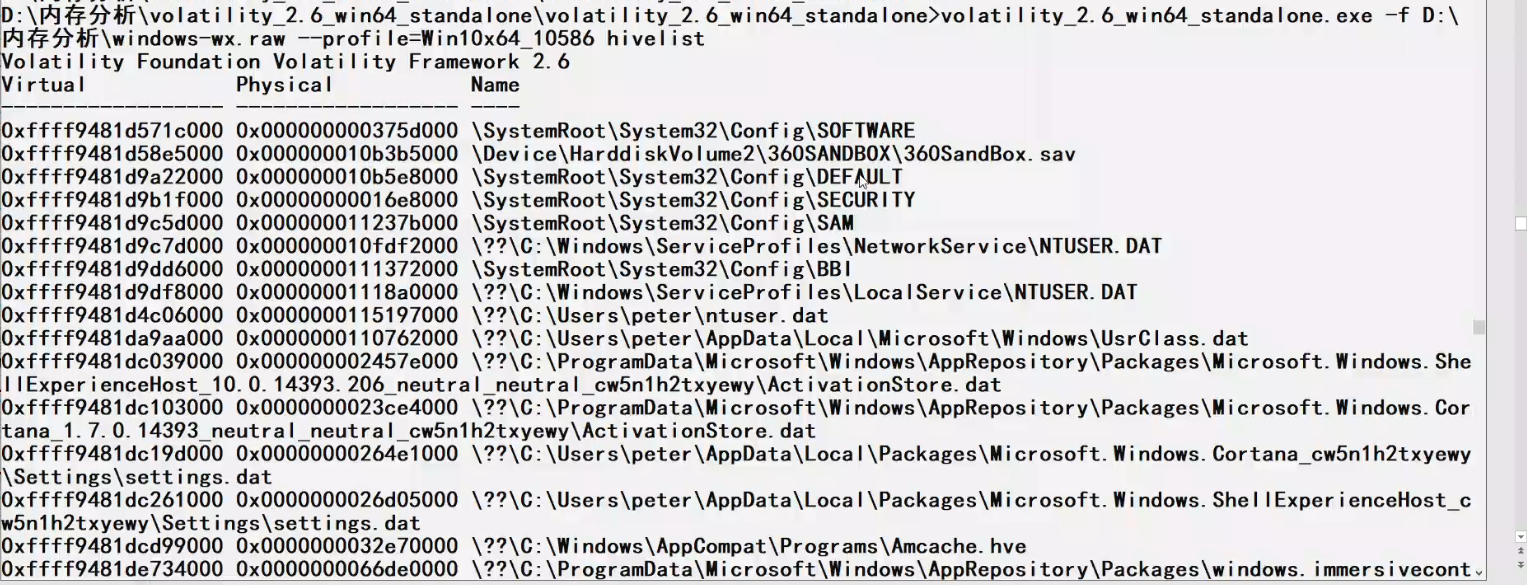
1 | volatility_2.6_win64_standalone.exe -f FILENAME --profile=版本号 hivelist |
该命令能列举在内存中的注册表
cmd命令情况
1 | volatility_2.6_win64_standalone.exe -f FILENAME --profile=版本号 cmdline |
该命令能提取内存中保留的cmd命令使用情况
获取SAM表中的用户
1 | volatility_2.6_win64_standalone.exe -f FILENAME --profile=版本号 printkey -K "SAM\Domprintkeyains\Account\Users\Names" |
注意”SAM\Domprintkeyains\Account\Users\Names”这个路径是固定的,不用改变。
最后登录的用户
1 | volatility_2.6_win64_standalone.exe -f FILENAME --profile=版本号 printkey -K "SOFTWARE\Microsoft\Windows NT\CurrentVersion\Winlogin" |
该名称能查看最后登录系统的账户
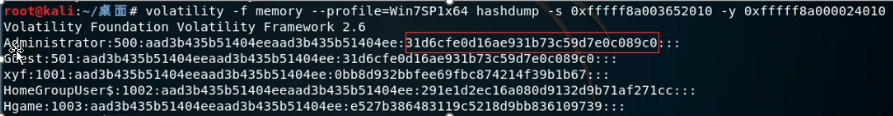
密码hash
1 | volatility_2.6_win64_standalone.exe -f FILENAME --profile=版本号 hashdump -y 注册表 system 的 virtual地址 -s SAM的virtual地址 |
该命令能从内存中获取密码hash
virtual从hivelist注册表中获得。
Windows服务
1 | volatility_2.6_win64_standalone.exe -f FILENAME --profile=版本号 svcscan |
该命令能查看Windwos的服务
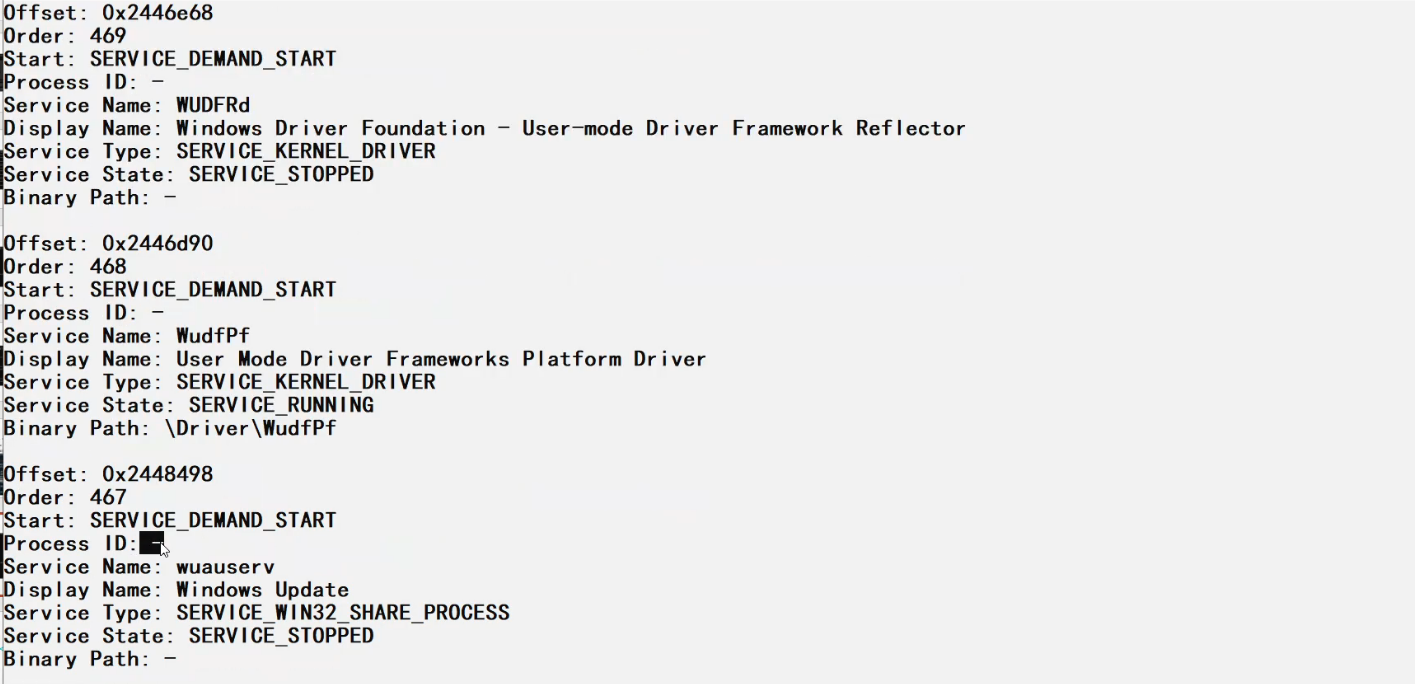
有些服务不一定有进程,所以PID为空。
MFT文件索引
NTFS文件系统是微软自Windows NT系统后引入的全新的文件系统。在NTFS文件系统里,磁盘上的所有东西都以文件的形式保存在NTFS分区内,包括文件系统自身的结构和记录也是如此。NTFS中,卷中所有存放的数据均在一个叫$MFT的文件中,叫主文件表(Master File Table),在MFT中保存了NTFS分区上所有文件的索引,操作系统根据这个索引来检索问价。在使用mftparser插件时发现了flag.zip 和 flag.rar
volatility -f mem.raw --profile=Win7SP1x86 mftparser > mft.txt
内容很多,随查找了一下flag关键字。

所有编辑框中的内容
这里有个更简单的办法,直接用editbox插件,即可看到系统中所有编辑控件中的编辑内容
1 | $ volatility2 -f ./mem.raw --profile=Win7SP1x86 editbox |
两个提取码和提取链接都找到了
插件列表
| 插件名称 | 功能 | 用法 |
|---|---|---|
| amcache | 查看AmCache应用程序痕迹信息 | |
| apihooks | 检测内核及进程的内存空间中的API hook | |
| atoms | 列出会话及窗口站atom表 | |
| atomscan | Atom表的池扫描(Pool scanner) | |
| auditpol | 列出注册表HKLM\SECURITY\Policy\PolAdtEv的审计策略信息 | |
| bigpools | 使用BigPagePoolScanner转储大分页池(big page pools) | |
| bioskbd | 从实时模式内存中读取键盘缓冲数据(早期电脑可以读取出BIOS开机密码) | |
| cachedump | 获取内存中缓存的域帐号的密码哈希 | |
| callbacks | 打印全系统通知例程 | |
| clipboard | 提取Windows剪贴板中的内容 | |
| cmdline | 显示进程命令行参数 | |
| cmdscan | 提取执行的命令行历史记录(扫描_COMMAND_HISTORY信息) | |
| connections | 打印系统打开的网络连接(仅支持Windows XP 和2003) | |
| connscan | 打印TCP连接信息 | |
| consoles | 提取执行的命令行历史记录(扫描_CONSOLE_INFORMATION信息) | |
| crashinfo | 提取崩溃转储信息 | |
| deskscan | tagDESKTOP池扫描(Poolscaner) | |
| devicetree | 显示设备树信息 | |
| dlldump | 从进程地址空间转储动态链接库 | |
| dlllist | 打印每个进程加载的动态链接库列表 | Vol.exe -f mem.raw –profile=Win7SP1x86 dlllist |
| driverirp | IRP hook驱动检测 | |
| drivermodule | 关联驱动对象至内核模块 | |
| driverscan | 驱动对象池扫描 | |
| dumpcerts | 提取RAS私钥及SSL公钥 | |
| dumpfiles | 提取内存中映射或缓存的文件 | |
| dumpregistry | 转储内存中注册表信息至磁盘 | Vol.exe -f mem.raw –profile=Win7SP1x86 dumpregistry |
| editbox | 查看Edit编辑控件信息 (Listbox正在实验中) | |
| envars | 显示进程的环境变量 | |
| eventhooks | 打印Windows事件hook详细信息 | |
| evtlogs | 提取Windows事件日志(仅支持XP/2003) | |
| filescan | 提取文件对象(file objects)池信息 | |
| gahti | 转储用户句柄(handle)类型信息 | |
| gditimers | 打印已安装的GDI计时器(timers)及回调(callbacks) | |
| gdt | 显示全局描述符表(Global Descriptor Table) | |
| getservicesids | 获取注册表中的服务名称并返回SID信息 | |
| getsids | 打印每个进程的SID信息 | |
| handles | 打印每个进程打开的句柄的列表(Offset(V), PID, handle, access, type, details) | vol.py -f “/path/to/file” ‑‑profile |
| hashdump | 转储内存中的Windows帐户密码哈希(LM/NTLM) | Vol.exe -f mem.raw –profile=Win7SP1x86 hashdump |
| hibinfo | 转储休眠文件信息 | |
| hivedump | 打印注册表配置单元信息 | |
| hivelist | 打印注册表配置单元列表 | |
| hivescan | 注册表配置单元池扫描 | |
| hpakextract | 从HPAK文件(Fast Dump格式)提取物理内存数据 | |
| hpakinfo | 查看HPAK文件属性及相关信息 | |
| idt | 显示中断描述符表(Interrupt Descriptor Table) | |
| iehistory | 重建IE缓存及访问历史记录 | Vol.exe -f mem.raw –profile=Win7SP1x86 iehistory |
| imagecopy | 将物理地址空间导出原生DD镜像文件 | |
| imageinfo | 查看/识别镜像信息 | |
| impscan | 扫描对导入函数的调用 | |
| joblinks | 打印进程任务链接信息 | |
| kdbgscan | 搜索和转储潜在KDBG值 | |
| kpcrscan | 搜索和转储潜在KPCR值 | |
| ldrmodules | 检测未链接的动态链接DLL | |
| lsadump | 从注册表中提取LSA密钥信息(已解密) | |
| machoinfo | 转储Mach-O 文件格式信息 | |
| malfind | 查找隐藏的和插入的代码 | |
| mbrparser | 扫描并解析潜在的主引导记录(MBR) | |
| memdump | 转储进程的可寻址内存 | |
| memmap | 打印内存映射 | |
| messagehooks | 桌面和窗口消息钩子的线程列表 | |
| mftparser | 扫描并解析潜在的MFT条目 | Vol.exe -f mem.raw –profile=Win7SP1x86 mftparser –output-file=mftverbose.txt -D mftoutput |
| moddump | 转储内核驱动程序到可执行文件的示例 | |
| modscan | 内核模块池扫描 | |
| modules | 打印加载模块的列表 | |
| multiscan | 批量扫描各种对象 | |
| mutantscan | 对互斥对象池扫描 | |
| notepad | 查看记事本当前显示的文本 | |
| netscan | 查看网络通讯连接 | Vol.exe -f mem.raw –profile=Win7SP1x86 netscan |
| objtypescan | 扫描窗口对象类型对象 | |
| patcher | 基于页面扫描的补丁程序内存 | |
| poolpeek | 可配置的池扫描器插件 | |
| printkey | 打印注册表项及其子项和值 | vol.py -f “/path/to/file” ‑‑profile |
| privs | 显示进程权限 | |
| procdump | 进程转储到一个可执行文件示例 | vol.py -f “/path/to/file” ‑‑profile |
| pslist | 按照EPROCESS列表打印所有正在运行的进程 | Vol.exe -f mem.raw –profile=Win7SP1x86 pslist |
| psscan | 进程对象池扫描 | |
| pstree | 以树型方式打印进程列表 | Vol.exe -f mem.raw –profile=Win7SP1x86 pstree |
| psxview | 查看进程列表(psx视图) | Vol.exe -f mem.raw –profile=Win7SP1x86 psxview |
| qemuinfo | 转储Qemu 信息 | |
| raw2dmp | 将物理内存原生数据转换为windbg崩溃转储格式 | |
| screenshot | 基于GDI Windows的虚拟屏幕截图保存 | |
| servicediff | Windows服务列表(ala Plugx) | |
| sessions | _MM_SESSION_SPACE的详细信息列表(用户登录会话) | |
| shellbags | 打印Shellbags信息 | Vol.exe -f mem.raw –profile=Win7SP1x86 shellbags |
| shimcache | 解析应用程序兼容性Shim缓存注册表项 | Vol.exe -f mem.raw –profile=Win7SP1x86 shimcache |
| shutdowntime | 从内存中的注册表信息获取机器关机时间 | Vol.exe -f mem.raw –profile=Win7SP1x86 shutdowntime |
| sockets | 打印已打开套接字列表 | |
| sockscan | TCP套接字对象池扫描 | |
| ssdt | 显示SSDT条目 | Vol.exe -f mem.raw –profile=Win7SP1x86 ssdt |
| strings | 物理到虚拟地址的偏移匹配(需要一些时间,带详细信息) | |
| svcscan | Windows服务列表扫描 | Vol.exe -f mem.raw –profile=Win7SP1x86 svcscan |
| symlinkscan | 符号链接对象池扫描 | |
| thrdscan | 线程对象池扫描 | |
| threads | 调查_ETHREAD 和_KTHREADs | |
| timeliner | 创建内存中的各种痕迹信息的时间线 | |
| timers | 打印内核计时器及关联模块的DPC | |
| truecryptmaster | 恢复TrueCrypt 7.1a主密钥 | Vol.exe -f mem.raw –profile=Win7SP1x86 truecryptmaster |
| truecryptpassphrase | 查找并提取TrueCrypt密码 | Vol.exe -f mem.raw –profile=Win7SP1x86 truecryptpassphrase |
| truecryptsummary | TrueCrypt摘要信息 | |
| unloadedmodules | 打印卸载的模块信息列表 | |
| userassist | 打印注册表中UserAssist相关信息 | Vol.exe -f mem.raw –profile=Win7SP1x86 userassist |
| userhandles | 转储用户句柄表 | |
| vaddump | 转储VAD数据为文件 | |
| vadinfo | 转储VAD信息 | |
| vadtree | 以树形方式显示VAD树信息 | |
| vadwalk | 显示遍历VAD树 | |
| vboxinfo | 转储Virtualbox信息(虚拟机) | |
| verinfo | 打印PE镜像中的版本信息 | |
| vmwareinfo | 转储VMware VMSS/VMSN 信息 | |
| volshell | 内存镜像中的shell | |
| windows | 打印桌面窗口(详细信息) | |
| wintree | Z顺序打印桌面窗口树 | |
| wndscan | 池扫描窗口站 | |
| yarascan | 以Yara签名扫描进程或内核内存 |
示例
forensic – RoarCTF
发现是内存取证,使用Volatility内存取证神器。
利用 npm install -g cnpm –registry=https://registry.npm.taobao.org-f mem.raw imageinfo`查看镜像信息
1 | ➜ RoarCTF volatility -f mem.raw imageinfo |
根据Suggested Profile(s)值猜测他是Win7SP1x86_23418,所以利用--profile=Win7SP1x86_23418
利用volatility -f mem.raw --profile=Win7SP0x86 psscan查看所有进程,通过所有进程来查看是否有可疑进程出现,进行进一步取证。
1 | ➜ RoarCTF volatility -f mem.raw --profile=Win7SP0x86 psscan |
通过观察进程可以看到 DumpIt.exe此项进程,这个便是dump内存时的进程。
进程中有notepad.exe进程PID为 3524 我们提取一下,看看有无线索.
利用 memdump 提取,文件将以进程号命名
1 | ➜ RoarCTF volatility -f mem.raw --profile=Win7SP0x86 memdump -p 3524 -D ./ |
查找 notpad 有关flag的
1 | ➜ RoarCTF strings 3524.dmp| grep flag |
然后i利用filescan插件查找一下有关flag的文件。
1 | ➜ RoarCTF volatility -f mem.raw --profile=Win7SP0x86 filescan | grep -E 'flag.zip|flag.rar|flag.txt' |
然后并没有找到,可能是已经被删除了
NTFS文件系统是微软自Windows NT系统后引入的全新的文件系统。在NTFS文件系统里,磁盘上的所有东西都以文件的形式保存在NTFS分区内,包括文件系统自身的结构和记录也是如此。NTFS中,卷中所有存放的数据均在一个叫$MFT的文件中,叫主文件表(Master File Table),在MFT中保存了NTFS分区上所有文件的索引,操作系统根据这个索引来检索问价。在使用mftparser插件时发现了flag.zip 和 flag.rar
volatility -f mem.raw --profile=Win7SP1x86 mftparser > mft.txt
内容很多,随查找了一下flag关键字。
继续查找flag关键字,找到了flag.zip 和 flag.rar 的十六进制 dump 下来

在压缩包里发现了flag.txt,接下来思路是找到 压缩包的密码
首先简单看了下图片。
volatility -f mem.raw --profile=Win7SP1x86 filescan | grep -E "png|jpg|jpeg"
1 | ➜ RoarCTF volatility -f mem.raw --profile=Win7SP0x86 filescan | grep -E 'png|jpg|jpeg' |
filesacn发现在我的文档,图片,文件夹里,有张图片 ,dumpfiles 下来就是flag.zip 的密码,成功拿到flag
1 | -Q参数使用物理偏移量进行转储 |

[VN2020 公开赛]内存取证
先使用volatility2
查看内存平台版本
1 | λ python2 D:\RayiTools\取证工具\volatility2\vol.py -f .\mem.raw imageinfo |
查看当前进程
1 | python2 D:\RayiTools\取证工具\volatility2\vol.py -f .\mem.raw --profile=Win7SP1x86 pstree |
pslist命令不仅显示了所有正在运行的进程,而且给出了有价值的信息,比如PID、PPID、启动的时间。
pstree与pslist命令不同的地方在于还可以识别子进程以及父进程
psscan命令可以显示出被恶意软件比如rootkit为了躲避用户或杀毒软件而隐藏的进程
pslist

pstree

psscan

其中有几个值得注意的进程
mspaint.exe微软画图工具notepad.exe记事本TrueCrypt.exe加密容器
要导出记事本的内容,可以现将记事本dump出来
1 | python2 D:\RayiTools\取证工具\volatility2\vol.py -f .\mem.raw --profile=Win7SP1x86 memdump -o 0x000000001f1f5d40 --dump-dir ./ |
然后用strings命令导出notepad中的字符串
在一大串字符串中可以找到这些东西

这里有个更简单的办法,直接用editbox插件,即可看到系统中所有编辑控件中的编辑内容
1 | $ volatility2 -f ./mem.raw --profile=Win7SP1x86 editbox |
两个提取码和提取链接都找到了
网盘里存的是VOL加密容器,下一步就是找truecrypt加密容器的解密办法
利用工具Elcomsoft Forensic Disk Decryptor
先dump出内存中的TrueCrypt.exe
然后打开工具


这样就有密钥了
一直下一步,挂载容器


打开里面有个key文件,内容如下
1 | uOjFdKu1jsbWI8N51jsbWI8N5 |
再用这个key去挂载容器


